Screen-Recording & Heatmaps
Screenrecording and Heatmaps are among the most important visual analysis tools in UX research. They provide retrospective, quantitative and context-sensitive data on the actual use of digital systems - such as websites, mobile apps or interactive web applications. Both methods help to make user behaviour visible and thus to make well-founded optimization decisions. They are particularly effective in live operation, i.e. under real conditions and with real users.
Screen Recording: a Look Through the Digital Keyhole
Screen recording involves recording the interaction of users with an interface - usually including mouse movements, clicks, scrolling and keystrokes. The method is ideal for subsequent analysis of real usage sessions, for example to identify friction, frequent navigation errors or repeated hesitation.
An example: A team observes that many users switch between the password field and the help link several times on a login page. The video analysis shows: Although the password request notice is present, it is visually inconspicuous. This insight leads to a design adjustment - the hint is displayed directly next to the input field.

Screen recordings are particularly helpful when it comes to recognizing specific weak points in user flows, e.g. in multi-stage processes such as checkout routes or registration forms. Device-specific differences - for example between desktop and mobile use - can also be evaluated for comparison.
Tools: Hotjar, Microsoft Clarity (free of charge), Smartlook, FullStory, Mouseflow Note: For sensitive content, GDPR-compliant solutions such as Piwik PRO or on-premise servers are important.
Heatmaps: Where to Click, Move and Scroll
Heatmaps visualize aggregated user behaviour on a page - typically color-coded: Red stands for frequent actions (hotspots), blue for infrequent ones (cold spots). There are different types of heatmaps:
- Click Heatmaps show where users click - even on non-interactive elements.
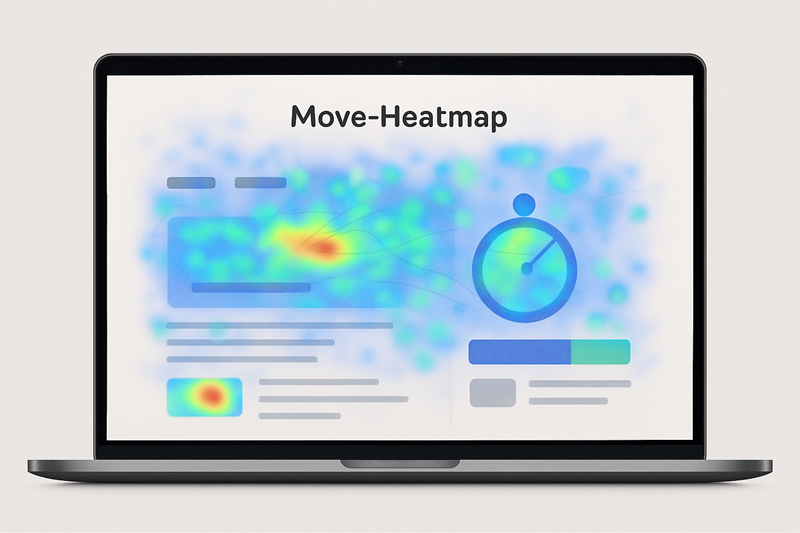
- Move-Heatmaps visualize mouse movements and provide indications of visual attention.
- Scroll_Heatmaps make visible where users actually scroll to.
- Attention Maps combine eye movement and activity, usually via eye tracking.
A practical example: A scroll heatmap shows that only 30% of visitors see the lower section of a landing page - even though a central call-to-action (“Contact us now”) is placed there. The conclusion: the message is moved to the top, the conversion rate increases by 18%.
Heatmaps are particularly useful for questions such as: “Is important content even perceived?” or “Are navigation elements placed in the right place?” They are also ideal for before-and-after comparisons in redesigns or A/B tests.
Limitations and Classification
Both methods provide what happens, but not why it happens. They do not show motives, emotions or mental models of the users. A click on a button can mean uncertainty, curiosity or mere trial and error - without additional qualitative methods, the interpretation remains speculative.
The following also applies: Heatmaps are context-specific - they must be analyzed separately for different pages and device types. A mobile heatmap differs significantly from its desktop version. In addition, data protection aspects must be observed: Usage recordings may only be made with explicit consent.
Best Practices from the Field
- Combination with KPIs: Heatmaps and screen recordings should be considered together with metrics such as bounce rate or conversion rate.
- Evaluate page and device-specific: This is the only way to make valid design decisions.
- Document changes: Ideal for before-after comparisons for UI customizations.
- Use Triangulation: Supplement visual data with interviews or thinking-aloud tests for a more complete picture.
- Systematic tagging: In tools such as FullStory or Lookback, anomalies can be marked and categorized.
Conclusion
Screen recordings and heat maps provide UX teams with immediate, visual access to the real user experience. They show what users actually do - and where they have difficulties. Used correctly, they provide reliable indications of optimization potential that can be easily communicated to stakeholders. Their greatest value lies in their combination: with qualitative insights, with quantitative metrics - and with the right instinct for design decisions.
Frequently asked questions (FAQ)
What is screen recording in UX research?
What are heatmaps?
What types of heatmaps are there?
What advantages do these methods offer?
What are the limitations of screen recordings and heatmaps?
Which tools are suitable?
Visual survey methods: Heatmaps, screenshots and screen recording
These studies shed light on the use of visual analysis methods such as heat maps, eye tracking, screenshots and screen recording to capture and interpret user behavior in UX research.
Usage and Application of Heatmap Visualizations on Usability User Testing
Comprehensive literature review on heatmaps. Emphasizes the lack of a standard process for combining heatmap analysis with qualitative usability data.
Dávila, F., Paz, F. A., & Moquillaza, A. (2023). Usage and application of heatmap visualizations on usability user testing: A systematic literature review. In Lecture Notes in Computer Science. https://doi.org/10.1007/978-3-031-35702-2_1
UX Heatmaps: Mapping User Experience on Visual Interfaces
Introduces a tool that triangulates gaze behavior with emotional states. Enables UX heatmaps to analyze cognitive load in UI areas.
Georges, V., Courtemanche, F., Sénécal, S., Baccino, T., Fredette, M., & Léger, P.-M. (2016). UX heatmaps: Mapping user experience on visual interfaces. In CHI Proceedings. https://doi.org/10.1145/2858036.2858271
Evaluation of Strong and Weak Signifiers in a Web Interface Using Eye-Tracking Heatmaps and Machine Learning
Uses heatmaps + machine learning to evaluate interface elements. Shows how automated heatmap analysis can contribute to usability evaluation.
Koonsanit, K., Tsunajima, T., & Nishiuchi, N. (2021). Evaluation of strong and weak signifiers in a web interface using eye-tracking heatmaps and machine learning. In CISIM Proceedings. https://doi.org/10.1007/978-3-030-84340-3_16
Contextual Cropping, Collateral Data: Screenshot Methods for UX Research
Describes the method of "contextual cropping" - selective screenshots with metadata for context analysis in UX studies.
Reimer, C. (2018). Contextual cropping, collateral data: Screenshot methods for UX research. Communication Design Quarterly, 6(3). https://doi.org/10.1145/3282665.3282673
Process Research Screen Capture
Considers screen recording as a multimodal research tool - suitable for qualitative, quantitative or mixed-methods approaches in UX.
Mroz, A. P. (2025). Process research screen capture. In The Encyclopedia of Applied Linguistics. https://doi.org/10.1002/9781405198431.wbeal1450.pub2
Last modified: 21 December 2025