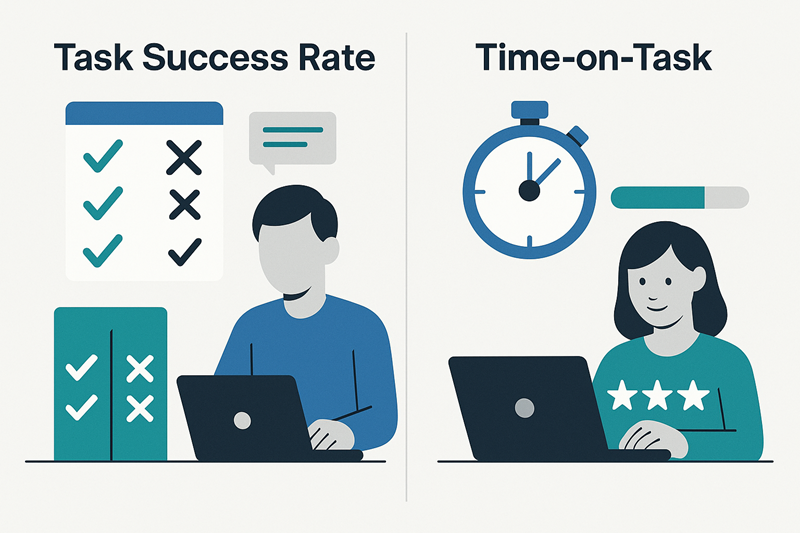
Task Success Rate & Time-on-Task
When users use a digital product, a central question arises: **Are they achieving their goals - and how efficiently are they doing so? Two of the most meaningful quantitative metrics in UX research answer precisely this question: the Task Success Rate and the Time-on-Task. Both metrics are robust, comparable and together form an objective basis for evaluating the usability of applications.
How Successful are Users? - The Task Success Rate
The so-called task resolution rate indicates how many people were able to complete a certain task completely and correctly. It is given as a percentage and is particularly suitable for measuring the effectiveness of a system.
Practical example
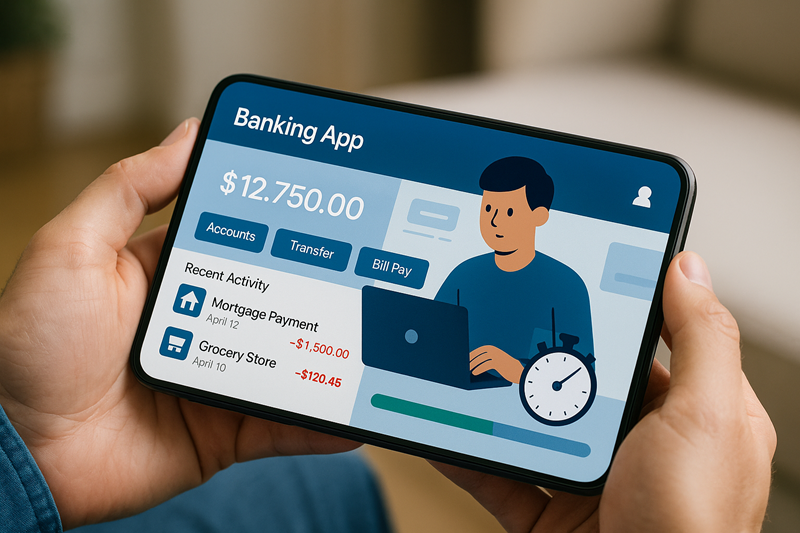
In a usability test, users were asked to open an account in a banking app. Out of ten test subjects, seven successfully get to the last step. Three aborted beforehand - partly because the “Next” button was difficult to see and partly because the input fields were unclear.
Result: Task Success Rate = 70 %. A clear indication of optimization potential in the onboarding process.
Variants of the Survey
- Binary: Success yes/no - easy to survey, but not very differentiated.
- Ratings: Additionally distinguish between “complete”, “partial” and “aborted” - particularly useful for complex tasks.
- Error-based: Additionally analyze why tasks fail - e.g. technical errors, misunderstandings, usability problems.
The success rate is also very suitable for comparisons between versions, e.g. for redesigns or A/B tests. The metric can also show whether improvements actually have an effect over longer periods of time.
How Efficient is the Use? - Time-on-task
While the success rate describes the achievement of a goal, the Time-on-Task records the effort required to achieve it - usually in the form of the time needed.
Practical example: In an e-commerce test, the order process on the old version of a checkout page took an average of 3:20 minutes. After a UI redesign, the processing time drops to 1:50 minutes. The average Time-on-Task is reduced by 45% - a clear indication of greater efficiency.
But: Less time is not automatically better. An extremely short time-on-task can also indicate superficial processing or lack of interest. Therefore, this metric should always be interpreted in the context of the task and user goals.
How is it Measured?
- For moderated tests: by stopwatch or digital timer
- For digital systems: automatically via log files, session recording or analytics
- Important: Start and end points must be clearly defined (e.g. first click on “Log in” to last entry)
Strong Together: Effectiveness & Efficiency
The two metrics only become fully meaningful when combined. A task can be completed quickly - but still fail frequently. Or it is usually completed successfully, but takes a remarkably long time.
| Metrics | Statement about |
|---|---|
| Task success rate | Effectiveness |
| Time-on-task | Efficiency |
Example combination: In an intranet test, 90% of users manage to find a specific piece of information - but it takes them over 4 minutes on average. The interpretation: The system works, but not efficiently. A better navigation or search function could help here.
Best Practices from the Field
- Formulate tasks realistically: The task should correspond to the real context of use.
- Operationalize start and end points: This is the only way to consistently record times and success rates.
- Do not simply delete outliers: A user needs 10 minutes because the interface is blocked in a certain constellation - this is not a “measurement error”, but a valuable insight.
- Triangulating with qualitative methods: Statements from interviews or thinking aloud help to interpret figures (“Why was the task difficult?”).
Conclusion
Task Success Rate and Time-on-Task are proven tools for making user performance measurable. As quantitative metrics, they provide clear, comparable and meaningful data about the usability of a system - provided they are used context-sensitively and methodically clean. In practice, they are indispensable for benchmarking, redesign evaluations and continuous UX optimization.
Frequently asked questions (FAQ)
What is the task success rate?
What does time-on-task mean?
How are these metrics collected?
Why are these key figures important?
What are the best practices?
When should you combine both metrics?
Quantitative usability measurement: task times, success rates and key figures
This literature selection highlights metrics of UX research such as task time, error frequency, success rates and composite indices. The focus is on statistical analysis and interpretation of quantitative usability data.
Quantifying User Research
Basic text on quantitative UX measurement with a focus on task times, success rates and error frequencies. Emphasizes statistical evaluability even with small samples.
Sauro, J., & Lewis, J. R. (2012). Quantifying user research. In Quantifying the User Experience. https://doi.org/10.1016/B978-0-12-384968-7.00002-3
Average Task Times in Usability Tests: What to Report?
Analyzes different methods for displaying task times. Recommends geometric mean over median or arithmetic mean for skewed data.
Sauro, J., & Lewis, J. R. (2010). Average task times in usability tests: what to report? In CHI Proceedings. https://doi.org/10.1145/1753326.1753679
Combined and Comparative Metrics
Introduction to the Single Usability Metric (SUM), which combines task success, time-on-task, errors and satisfaction into a comparative index.
Tullis, T. S., & Albert, B. (2013). Combined and comparative metrics. In Measuring the User Experience. https://doi.org/10.1016/B978-0-12-415781-1.00008-X
Variation in Importance of Time-on-Task with Familiarity
Shows that the perception of usability correlates more strongly with time-on-task the more familiar users are with a product.
Suzuki, S., Bellotti, V., Yee, N., et al. (2011). Variation in importance of time-on-task with familiarity. In CHI. https://doi.org/10.1145/1978942.1979314
Usability Testing Through Devices in Bangladesh
Comparison of task success rate and task times on mobile vs. desktop devices for a university website. Provides real benchmarks and application scenarios.
Yesmin, S., & Atikuzzaman, M. (2023). Usability testing of a website through different devices: a task-based approach. Information Discovery and Delivery. https://doi.org/10.1108/IDD-01-2023-0007
Last modified: 21 December 2025